1 - User settings
Manage your profile information, account defaults, alerts, participation in beta products, GitHub integration, storage usage, account activation, and create teams in your user settings.
Navigate to your user profile page and select your user icon on the top right corner. From the dropdown, choose Settings.
Profile
Within the Profile section you can manage and modify your account name and institution. You can optionally add a biography, location, link to a personal or your institution’s website, and upload a profile image.
Edit your intro
To edit your intro, click Edit at the top of your profile. The WYSIWYG editor that opens supports Markdown.
- To edit a line, click it. To save time, you can type
/ and choose Markdown from the list.
- Use an item’s drag handles to move it.
- To delete a block, click the drag handle, then click Delete.
- To save your changes, click Save.
Add social badges
To add a follow badge for the @weights_biases account on X, you could add a Markdown-style link with an HTML <img> tag that points to the badge image:
[](https://x.com/intent/follow?screen_name=weights_biases)
In an <img> tag, you can specify width, height, or both. If you specify only one of them, the image’s proportions are maintained.
Teams
Create a new team in the Team section. To create a new team, select the New team button and provide the following:
- Team name - the name of your team. The team mane must be unique. Team names can not be changed.
- Team type - Select either the Work or Academic button.
- Company/Organization - Provide the name of the team’s company or organization. Choose the dropdown menu to select a company or organization. You can optionally provide a new organization.
Only administrative accounts can create a team.
Beta features
Within the Beta Features section you can optionally enable fun add-ons and sneak previews of new products in development. Select the toggle switch next to the beta feature you want to enable.
Alerts
Get notified when your runs crash, finish, or set custom alerts with wandb.Run.alert(). Receive notifications either through Email or Slack. Toggle the switch next to the event type you want to receive alerts from.
- Runs finished: whether a Weights and Biases run successfully finished.
- Run crashed: notification if a run has failed to finish.
For more information about how to set up and manage alerts, see Send alerts with wandb.Run.alert().
Personal GitHub integration
Connect a personal Github account. To connect a Github account:
- Select the Connect Github button. This will redirect you to an open authorization (OAuth) page.
- Select the organization to grant access in the Organization access section.
- Select Authorize wandb.
Delete your account
Select the Delete Account button to delete your account.
Account deletion can not be reversed.
Storage
The Storage section describes the total memory usage the your account has consumed on the Weights and Biases servers. The default storage plan is 100GB. For more information about storage and pricing, see the Pricing page.
2 - Billing settings
Manage your organization’s billing settings
Navigate to your user profile page and select your user icon on the top right corner. From the dropdown, choose Billing, or choose Settings and then select the Billing tab.
Plan details
The Plan details section summarizes your organization’s current plan, charges, limits, and usage.
- For details and a list of users, click Manage users.
- For details about usage, click View usage.
- Amount of storage your organization uses, both free and paid. From here, you can purchase additional storage and manage storage that is currently in use. Learn more about storage settings.
From here, you can compare plans or talk to Sales.
Plan usage
This section visually summarizes current usage and displays upcoming usage charges. For detailed insights into usage by month, click View usage on an individual tile. To export usage by calendar month, team, or project, click Export CSV.
Usage alerts
For organizations on paid plans, admins receive alerts via email once per billing period when certain thresholds are met, along with details about how to increase your organization’s limits if you are a billing admin and how to contact a billing admin otherwise. On the Pro plan, only the billing admin receives usage alerts.
These alerts are not configurable, and are sent when:
- Your organization is approaching a monthly limit of a category of usage (85% of hours used) and when it reaches 100% of the limit, according to your plan.
- Your organization’s accumulated average charges for a billing period exceed these thresholds: $200, $450, $700, and $1000. These overage charges are incurred when your organization accumulates more usage than your plan includes for tracked hours, storage, or Weave data ingestion.
For questions about usage or billing, contact your account team or Support.
Payment methods
This section shows the payment methods on file for your organization. If you have not added a payment method, you will be prompted to do so when you upgrade your plan or add paid storage.
Billing admin
This section shows the current billing admin. The billing admin is an organization admin, receives all billing-related emails, and can view and manage payment methods.
In W&B Dedicated Cloud, multiple users can be billing admins. In W&B Multi-tenant Cloud, only one user at a time can be the billing admin.
To change the billing admin or assign the role to additional users:
- Click Manage roles.
- Search for a user.
- Click the Billing admin field in that user’s row.
- Read the summary, then click Change billing user.
Invoices
If you pay using a credit card, this section allows you to view monthly invoices.
- For Enterprise accounts that pay via wire transfer, this section is blank. For questions, contact your account team.
- If your organization incurs no charges, no invoice is generated.
3 - Team settings
Manage a team’s members, avatar, alerts, and privacy settings with the Team Settings page.
Team settings
Change your team’s settings, including members, avatar, alerts, privacy, and usage. Organization admins and team admins can view and edit a team’s settings.
Only Administration account types can change team settings or remove a member from a team.
Members
The Members section shows a list of all pending invitations and the members that have either accepted the invitation to join the team. Each member listed displays a member’s name, username, email, team role, as well as their access privileges to Models and Weave, which is inherited by from the Organization. You can choose from the standard team roles Admin, Member, and View-only. If your organization has created custom roles, you can assign a custom role instead.
See Add and Manage teams for information on how to create a team, manage teams, and manage team membership and roles. To configure who can invite new members and configure other privacy settings for the team, refer to Privacy.
Avatar
Set an avatar by navigating to the Avatar section and uploading an image.
- Select the Update Avatar to prompt a file dialog to appear.
- From the file dialog, choose the image you want to use.
Alerts
Notify your team when runs crash, finish, or set custom alerts. Your team can receive alerts either through email or Slack.
Toggle the switch next to the event type you want to receive alerts from. Weights and Biases provides the following event type options be default:
- Runs finished: whether a Weights and Biases run successfully finished.
- Run crashed: if a run has failed to finish.
For more information about how to set up and manage alerts, see Send alerts with wandb.Run.alert().
Slack notifications
Configure Slack destinations where your team’s automations can send notifications when an event occurs in a Registry or a project, such as when a new artifact is created or when a run metric meets a defined threshold. Refer to Create a Slack automation.
This feature is available for all Enterprise licenses.
Webhooks
Configure webhooks that your team’s automations can run when an event occurs in a Registry or a project, such as when a new artifact is created or when a run metric meets a defined threshold. Refer to Create a webhook automation.
This feature is available for all Enterprise licenses.
Privacy
Navigate to the Privacy section to change privacy settings. Only organization admins can modify privacy setting.
- Turn off the ability to make future projects public or to share reports publicly.
- Allow any team member to invite other members, rather than only team admins.
- Manage whether code saving is turned on by default.
Usage
The Usage section describes the total memory usage the team has consumed on the Weights and Biases servers. The default storage plan is 100GB. For more information about storage and pricing, see the Pricing page.
Storage
The Storage section describes the cloud storage bucket configuration that is being used for the team’s data. For more information, see Secure Storage Connector or check out our W&B Server docs if you are self-hosting.
4 - Email settings
Manage emails from the Settings page.
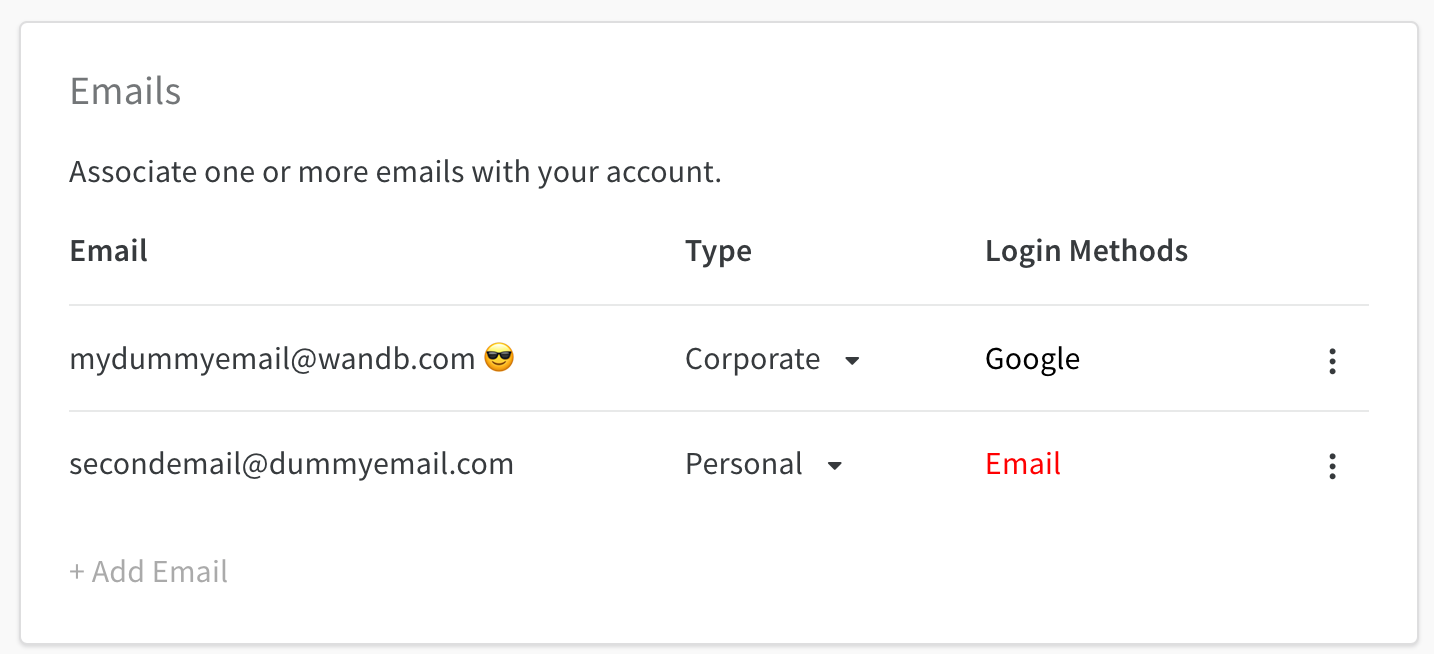
Add, delete, manage email types and primary email addresses in your W&B Profile Settings page. Select your profile icon in the upper right corner of the W&B dashboard. From the dropdown, select Settings. Within the Settings page, scroll down to the Emails dashboard:

Manage primary email
The primary email is marked with a 😎 emoji. The primary email is automatically defined with the email you provided when you created a W&B account.
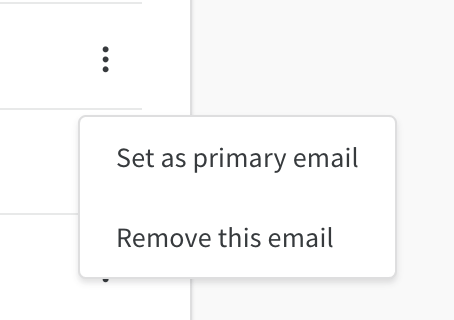
Select the kebab dropdown to change the primary email associated with your Weights And Biases account:
Only verified emails can be set as primary

Add emails
Select + Add Email to add an email. This will take you to an Auth0 page. You can enter in the credentials for the new email or connect using single sign-on (SSO).
Delete emails
Select the kebab dropdown and choose Delete Emails to delete an email that is registered to your W&B account
Primary emails cannot be deleted. You need to set a different email as a primary email before deleting.
Log in methods
The Log in Methods column displays the log in methods that are associated with your account.
A verification email is sent to your email account when you create a W&B account. Your email account is considered unverified until you verify your email address. Unverified emails are displayed in red.
Attempt to log in with your email address again to retrieve a second verification email if you no longer have the original verification email that was sent to your email account.
Contact support@wandb.com for account log in issues.
5 - Manage teams
Collaborate with your colleagues, share results, and track all the experiments across your team
Use W&B Teams as a central workspace for your ML team to build better models faster.
- Track all the experiments your team has tried so you never duplicate work.
- Save and reproduce previously trained models.
- Share progress and results with your boss and collaborators.
- Catch regressions and immediately get alerted when performance drops.
- Benchmark model performance and compare model versions.

Create a collaborative team
- Sign up or log in to your free W&B account.
- Click Invite Team in the navigation bar.
- Create your team and invite collaborators.
- To configure your team, refer to Manage team settings.
Note: Only the admin of an organization can create a new team.
Create a team profile
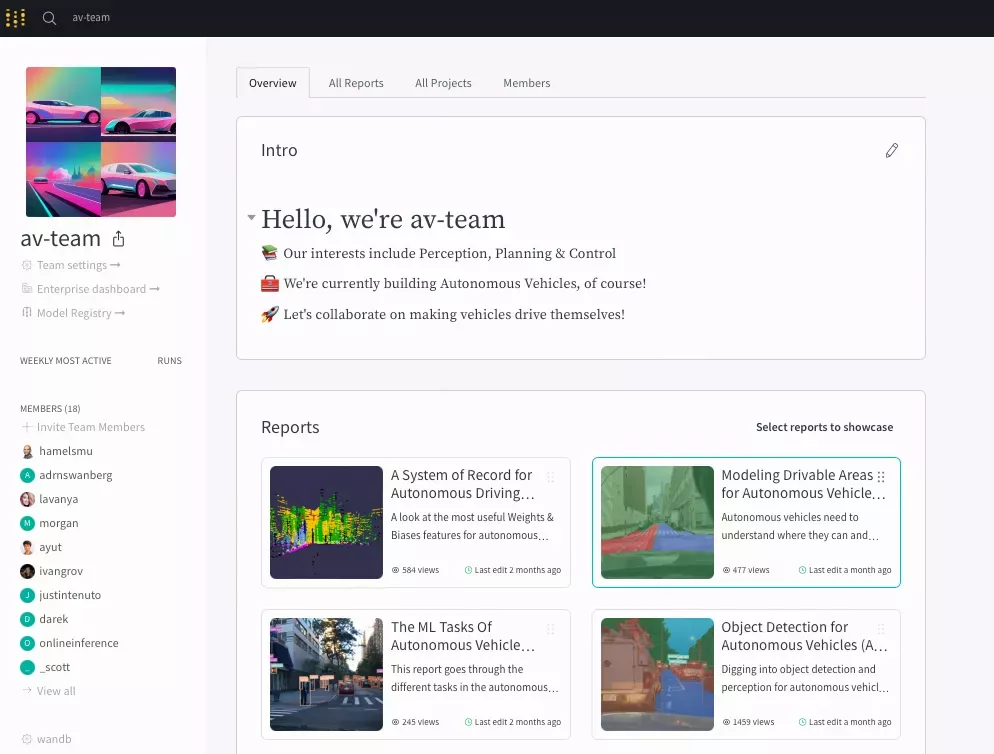
You can customize your team’s profile page to show an introduction and showcase reports and projects that are visible to the public or team members. Present reports, projects, and external links.
- Highlight your best research to visitors by showcasing your best public reports
- Showcase the most active projects to make it easier for teammates to find them
- Find collaborators by adding external links to your company or research lab’s website and any papers you’ve published
Remove team members
Team admins can open the team settings page and click the delete button next to the departing member’s name. Any runs logged to the team remain after a user leaves.
Manage team roles and permissions
Select a team role when you invite colleagues to join a team. There are following team role options:
- Admin: Team admins can add and remove other admins or team members. They have permissions to modify all projects and full deletion permissions. This includes, but is not limited to, deleting runs, projects, artifacts, and sweeps.
- Member: A regular member of the team. By default, only an admin can invite a team member. To change this behavior, refer to Manage team settings.
A team member can delete only runs they created. Suppose you have two members A and B. Member B moves a run from team B’s project to a different project owned by Member A. Member A cannot delete the run Member B moved to Member A’s project. An admin can manage runs and sweep runs created by any team member.
- View-Only (Enterprise-only feature): View-Only members can view assets within the team such as runs, reports, and workspaces. They can follow and comment on reports, but they can not create, edit, or delete project overview, reports, or runs.
- Custom roles (Enterprise-only feature): Custom roles allow organization admins to compose new roles based on either of the View-Only or Member roles, together with additional permissions to achieve fine-grained access control. Team admins can then assign any of those custom roles to users in their respective teams. Refer to Introducing Custom Roles for W&B Teams for details.
- Service accounts (Enterprise-only feature): Refer to Use service accounts to automate workflows.
W&B recommends to have more than one admin in a team. It is a best practice to ensure that admin operations can continue when the primary admin is not available.
Team settings
Team settings allow you to manage the settings for your team and its members. With these privileges, you can effectively oversee and organize your team within W&B.
| Permissions |
View-Only |
Team Member |
Team Admin |
| Add team members |
|
|
X |
| Remove team members |
|
|
X |
| Manage team settings |
|
|
X |
Registry
The proceeding table lists permissions that apply to all projects across a given team.
| Permissions |
View-Only |
Team Member |
Registry Admin |
Team Admin |
| Add aliases |
|
X |
X |
X |
| Add models to the registry |
|
X |
X |
X |
| View models in the registry |
X |
X |
X |
X |
| Download models |
X |
X |
X |
X |
| Add or remove Registry Admins |
|
|
X |
X |
| Add or remove Protected Aliases |
|
|
X |
|
For more details about protected aliases, refer to Registry Access Controls.
Reports
Report permissions grant access to create, view, and edit reports. The proceeding table lists permissions that apply to all reports across a given team.
| Permissions |
View-Only |
Team Member |
Team Admin |
| View reports |
X |
X |
X |
| Create reports |
|
X |
X |
| Edit reports |
|
X (team members can only edit their own reports) |
X |
| Delete reports |
|
X (team members can only edit their own reports) |
X |
Experiments
The proceeding table lists permissions that apply to all experiments across a given team.
| Permissions |
View-Only |
Team Member |
Team Admin |
| View experiment metadata (includes history metrics, system metrics, files, and logs) |
X |
X |
X |
| Edit experiment panels and workspaces |
|
X |
X |
| Log experiments |
|
X |
X |
| Delete experiments |
|
X (team members can only delete experiments they created) |
X |
| Stop experiments |
|
X (team members can only stop experiments they created) |
X |
Artifacts
The proceeding table lists permissions that apply to all artifacts across a given team.
| Permissions |
View-Only |
Team Member |
Team Admin |
| View artifacts |
X |
X |
X |
| Create artifacts |
|
X |
X |
| Delete artifacts |
|
X |
X |
| Edit metadata |
|
X |
X |
| Edit aliases |
|
X |
X |
| Delete aliases |
|
X |
X |
| Download artifact |
|
X |
X |
System settings (W&B Server only)
Use system permissions to create and manage teams and their members and to adjust system settings. These privileges enable you to effectively administer and maintain the W&B instance.
| Permissions |
View-Only |
Team Member |
Team Admin |
System Admin |
| Configure system settings |
|
|
|
X |
| Create/delete teams |
|
|
|
X |
Team service account behavior
- When you configure a team in your training environment, you can use a service account from that team to log runs in either of private or public projects within that team. Additionally, you can attribute those runs to a user if WANDB_USERNAME or WANDB_USER_EMAIL variable exists in your environment and the referenced user is part of that team.
- When you do not configure a team in your training environment and use a service account, the runs log to the named project within that service account’s parent team. In this case as well, you can attribute the runs to a user if WANDB_USERNAME or WANDB_USER_EMAIL variable exists in your environment and the referenced user is part of the service account’s parent team.
- A service account can not log runs to a private project in a team different from its parent team. A service account can log to runs to project only if the project is set to
Open project visibility.
Team trials
See the pricing page for more information on W&B plans. You can download all your data at any time, either using the dashboard UI or the Export API.
Privacy settings
You can see the privacy settings of all team projects on the team settings page:
app.wandb.ai/teams/your-team-name
Advanced configuration
Secure storage connector
The team-level secure storage connector allows teams to use their own cloud storage bucket with W&B. This provides greater data access control and data isolation for teams with highly sensitive data or strict compliance requirements. Refer to Secure Storage Connector for more information.
7 - System metric settings
Metrics automatically logged by W&B.
This page provides detailed information about the system metrics that are tracked by the W&B SDK.
wandb automatically logs system metrics every 15 seconds.
CPU
Process CPU Percent (CPU)
Percentage of CPU usage by the process, normalized by the number of available CPUs.
W&B assigns a cpu tag to this metric.
Process CPU Threads
The number of threads utilized by the process.
W&B assigns a proc.cpu.threads tag to this metric.
Disk
By default, the usage metrics are collected for the / path. To configure the paths to be monitored, use the following setting:
run = wandb.init(
    settings=wandb.Settings(
        x_stats_disk_paths=("/System/Volumes/Data", "/home", "/mnt/data"),
    ),
)
Disk Usage Percent
Represents the total system disk usage in percentage for specified paths.
W&B assigns a disk.{path}.usagePercent tag to this metric.
Disk Usage
Represents the total system disk usage in gigabytes (GB) for specified paths.
The paths that are accessible are sampled, and the disk usage (in GB) for each path is appended to the samples.
W&B assigns a disk.{path}.usageGB tag to this metric.
Disk In
Indicates the total system disk read in megabytes (MB).
The initial disk read bytes are recorded when the first sample is taken. Subsequent samples calculate the difference between the current read bytes and the initial value.
W&B assigns a disk.in tag to this metric.
Disk Out
Represents the total system disk write in megabytes (MB).
Similar to Disk In, the initial disk write bytes are recorded when the first sample is taken. Subsequent samples calculate the difference between the current write bytes and the initial value.
W&B assigns a disk.out tag to this metric.
Memory
Represents the Memory Resident Set Size (RSS) in megabytes (MB) for the process. RSS is the portion of memory occupied by a process that is held in main memory (RAM).
W&B assigns a proc.memory.rssMB tag to this metric.
Process Memory Percent
Indicates the memory usage of the process as a percentage of the total available memory.
W&B assigns a proc.memory.percent tag to this metric.
Memory Percent
Represents the total system memory usage as a percentage of the total available memory.
W&B assigns a memory_percent tag to this metric.
Memory Available
Indicates the total available system memory in megabytes (MB).
W&B assigns a proc.memory.availableMB tag to this metric.
Network
Network Sent
Represents the total bytes sent over the network.
The initial bytes sent are recorded when the metric is first initialized. Subsequent samples calculate the difference between the current bytes sent and the initial value.
W&B assigns a network.sent tag to this metric.
Network Received
Indicates the total bytes received over the network.
Similar to Network Sent, the initial bytes received are recorded when the metric is first initialized. Subsequent samples calculate the difference between the current bytes received and the initial value.
W&B assigns a network.recv tag to this metric.
NVIDIA GPU
In addition to the metrics described below, if the process and/or its descendants use a particular GPU, W&B captures the corresponding metrics as gpu.process.{gpu_index}.{metric_name}
GPU Memory Utilization
Represents the GPU memory utilization in percent for each GPU.
W&B assigns a gpu.{gpu_index}.memory tag to this metric.
GPU Memory Allocated
Indicates the GPU memory allocated as a percentage of the total available memory for each GPU.
W&B assigns a gpu.{gpu_index}.memoryAllocated tag to this metric.
GPU Memory Allocated Bytes
Specifies the GPU memory allocated in bytes for each GPU.
W&B assigns a gpu.{gpu_index}.memoryAllocatedBytes tag to this metric.
GPU Utilization
Reflects the GPU utilization in percent for each GPU.
W&B assigns a gpu.{gpu_index}.gpu tag to this metric.
GPU Temperature
The GPU temperature in Celsius for each GPU.
W&B assigns a gpu.{gpu_index}.temp tag to this metric.
GPU Power Usage Watts
Indicates the GPU power usage in Watts for each GPU.
W&B assigns a gpu.{gpu_index}.powerWatts tag to this metric.
GPU Power Usage Percent
Reflects the GPU power usage as a percentage of its power capacity for each GPU.
W&B assigns a gpu.{gpu_index}.powerPercent tag to this metric.
GPU SM Clock Speed
Represents the clock speed of the Streaming Multiprocessor (SM) on the GPU in MHz. This metric is indicative of the processing speed within the GPU cores responsible for computation tasks.
W&B assigns a gpu.{gpu_index}.smClock tag to this metric.
GPU Memory Clock Speed
Represents the clock speed of the GPU memory in MHz, which influences the rate of data transfer between the GPU memory and processing cores.
W&B assigns a gpu.{gpu_index}.memoryClock tag to this metric.
GPU Graphics Clock Speed
Represents the base clock speed for graphics rendering operations on the GPU, expressed in MHz. This metric often reflects performance during visualization or rendering tasks.
W&B assigns a gpu.{gpu_index}.graphicsClock tag to this metric.
GPU Corrected Memory Errors
Tracks the count of memory errors on the GPU that W&B automatically corrects by error-checking protocols, indicating recoverable hardware issues.
W&B assigns a gpu.{gpu_index}.correctedMemoryErrors tag to this metric.
GPU Uncorrected Memory Errors
Tracks the count of memory errors on the GPU that W&B uncorrected, indicating non-recoverable errors which can impact processing reliability.
W&B assigns a gpu.{gpu_index}.unCorrectedMemoryErrors tag to this metric.
GPU Encoder Utilization
Represents the percentage utilization of the GPU’s video encoder, indicating its load when encoding tasks (for example, video rendering) are running.
W&B assigns a gpu.{gpu_index}.encoderUtilization tag to this metric.
AMD GPU
W&B extracts metrics from the output of the rocm-smi tool supplied by AMD (rocm-smi -a --json).
ROCm 6.x (latest) and 5.x formats are supported. Learn more about ROCm formats in the AMD ROCm documentation. The newer format includes more details.
AMD GPU Utilization
Represents the GPU utilization in percent for each AMD GPU device.
W&B assigns a gpu.{gpu_index}.gpu tag to this metric.
AMD GPU Memory Allocated
Indicates the GPU memory allocated as a percentage of the total available memory for each AMD GPU device.
W&B assigns a gpu.{gpu_index}.memoryAllocated tag to this metric.
AMD GPU Temperature
The GPU temperature in Celsius for each AMD GPU device.
W&B assigns a gpu.{gpu_index}.temp tag to this metric.
AMD GPU Power Usage Watts
The GPU power usage in Watts for each AMD GPU device.
W&B assigns a gpu.{gpu_index}.powerWatts tag to this metric.
AMD GPU Power Usage Percent
Reflects the GPU power usage as a percentage of its power capacity for each AMD GPU device.
W&B assigns a gpu.{gpu_index}.powerPercent to this metric.
Apple ARM Mac GPU
Apple GPU Utilization
Indicates the GPU utilization in percent for Apple GPU devices, specifically on ARM Macs.
W&B assigns a gpu.0.gpu tag to this metric.
Apple GPU Memory Allocated
The GPU memory allocated as a percentage of the total available memory for Apple GPU devices on ARM Macs.
W&B assigns a gpu.0.memoryAllocated tag to this metric.
Apple GPU Temperature
The GPU temperature in Celsius for Apple GPU devices on ARM Macs.
W&B assigns a gpu.0.temp tag to this metric.
Apple GPU Power Usage Watts
The GPU power usage in Watts for Apple GPU devices on ARM Macs.
W&B assigns a gpu.0.powerWatts tag to this metric.
Apple GPU Power Usage Percent
The GPU power usage as a percentage of its power capacity for Apple GPU devices on ARM Macs.
W&B assigns a gpu.0.powerPercent tag to this metric.
Graphcore IPU
Graphcore IPUs (Intelligence Processing Units) are unique hardware accelerators designed specifically for machine intelligence tasks.
IPU Device Metrics
These metrics represent various statistics for a specific IPU device. Each metric has a device ID (device_id) and a metric key (metric_key) to identify it. W&B assigns a ipu.{device_id}.{metric_key} tag to this metric.
Metrics are extracted using the proprietary gcipuinfo library, which interacts with Graphcore’s gcipuinfo binary. The sample method fetches these metrics for each IPU device associated with the process ID (pid). Only the metrics that change over time, or the first time a device’s metrics are fetched, are logged to avoid logging redundant data.
For each metric, the method parse_metric is used to extract the metric’s value from its raw string representation. The metrics are then aggregated across multiple samples using the aggregate method.
The following lists available metrics and their units:
- Average Board Temperature (
average board temp (C)): Temperature of the IPU board in Celsius.
- Average Die Temperature (
average die temp (C)): Temperature of the IPU die in Celsius.
- Clock Speed (
clock (MHz)): The clock speed of the IPU in MHz.
- IPU Power (
ipu power (W)): Power consumption of the IPU in Watts.
- IPU Utilization (
ipu utilisation (%)): Percentage of IPU utilization.
- IPU Session Utilization (
ipu utilisation (session) (%)): IPU utilization percentage specific to the current session.
- Data Link Speed (
speed (GT/s)): Speed of data transmission in Giga-transfers per second.
Google Cloud TPU
Tensor Processing Units (TPUs) are Google’s custom-developed ASICs (Application Specific Integrated Circuits) used to accelerate machine learning workloads.
TPU Memory usage
The current High Bandwidth Memory usage in bytes per TPU core.
W&B assigns a tpu.{tpu_index}.memoryUsageBytes tag to this metric.
TPU Memory usage percentage
The current High Bandwidth Memory usage in percent per TPU core.
W&B assigns a tpu.{tpu_index}.memoryUsageBytes tag to this metric.
TPU Duty cycle
TensorCore duty cycle percentage per TPU device. Tracks the percentage of time over the sample period during which the accelerator TensorCore was actively processing. A larger value means better TensorCore utilization.
W&B assigns a tpu.{tpu_index}.dutyCycle tag to this metric.
AWS Trainium
AWS Trainium is a specialized hardware platform offered by AWS that focuses on accelerating machine learning workloads. The neuron-monitor tool from AWS is used to capture the AWS Trainium metrics.
Trainium Neuron Core Utilization
The utilization percentage of each NeuronCore, reported on a per-core basis.
W&B assigns a trn.{core_index}.neuroncore_utilization tag to this metric.
Trainium Host Memory Usage, Total
The total memory consumption on the host in bytes.
W&B assigns a trn.host_total_memory_usage tag to this metric.
Trainium Neuron Device Total Memory Usage
The total memory usage on the Neuron device in bytes.
W&B assigns a trn.neuron_device_total_memory_usage) tag to this metric.
Trainium Host Memory Usage Breakdown:
The following is a breakdown of memory usage on the host:
- Application Memory (
trn.host_total_memory_usage.application_memory): Memory used by the application.
- Constants (
trn.host_total_memory_usage.constants): Memory used for constants.
- DMA Buffers (
trn.host_total_memory_usage.dma_buffers): Memory used for Direct Memory Access buffers.
- Tensors (
trn.host_total_memory_usage.tensors): Memory used for tensors.
Trainium Neuron Core Memory Usage Breakdown
Detailed memory usage information for each NeuronCore:
- Constants (
trn.{core_index}.neuroncore_memory_usage.constants)
- Model Code (
trn.{core_index}.neuroncore_memory_usage.model_code)
- Model Shared Scratchpad (
trn.{core_index}.neuroncore_memory_usage.model_shared_scratchpad)
- Runtime Memory (
trn.{core_index}.neuroncore_memory_usage.runtime_memory)
- Tensors (
trn.{core_index}.neuroncore_memory_usage.tensors)
OpenMetrics
Capture and log metrics from external endpoints that expose OpenMetrics / Prometheus-compatible data with support for custom regex-based metric filters to be applied to the consumed endpoints.
Refer to Monitoring GPU cluster performance in W&B for a detailed example of how to use this feature in a particular case of monitoring GPU cluster performance with the NVIDIA DCGM-Exporter.
